MoCSI simulation examples
Simulating temperatures in Ryugu’s Kolobok crater
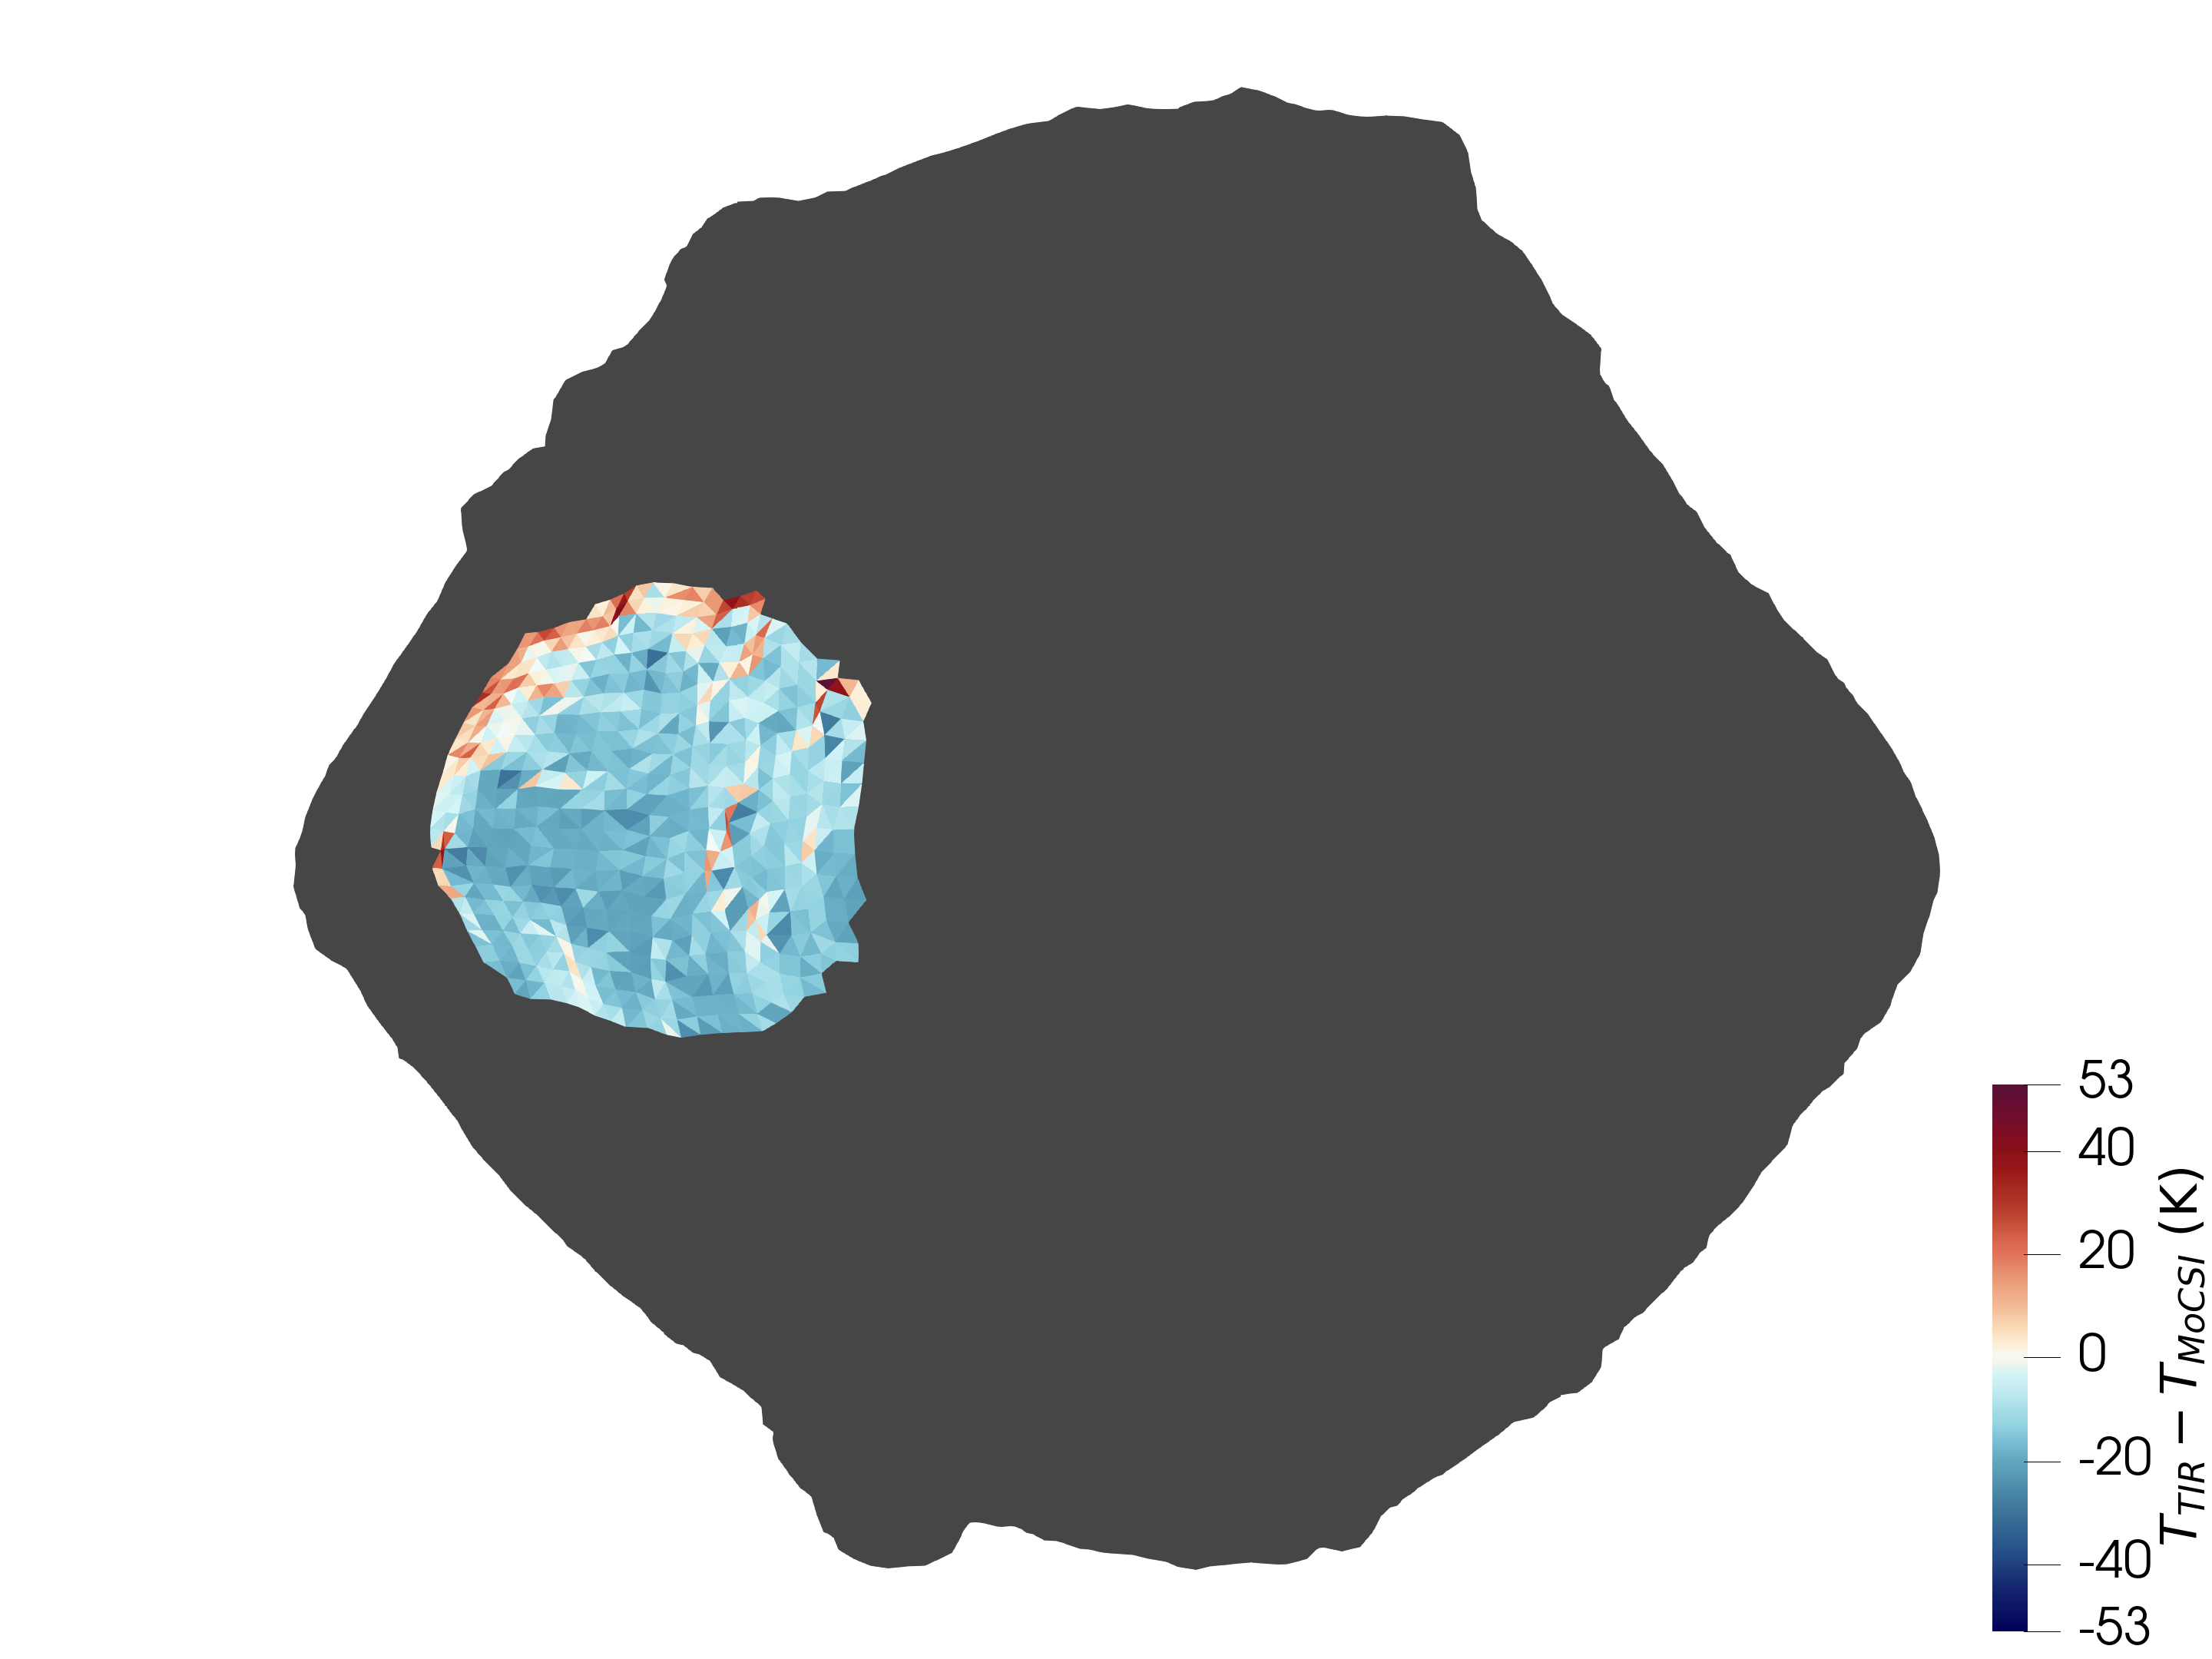
We simulated the surface temperatures within Ryugu’s Kolobok crater on 2018-08-01. The Kolobok crater is a central, large crater (240 m, 1.5° S) on the equatorial ridge of Ryugu. The simulation results can be compared to the TIR l3 dataset acquired by the TIR instrument during the Hayabusa2 mission. We used a low-resolution shapemodel, the Hayabusa2 SPICE kernels and enabled the radiosity module to account for scattered light and self heating. You can find further details in Schuckart et al. (submitted).
Here is a zoomed-in version of the temperature evolution:
The differences between the measured and mapped TIR temperatures (2018-08-01T18:16:32) and the simulated temperatures are shown below. The absolute median difference between the TIR temperature and the simulated temperature is 16 K, with the simulated temperatures being hotter. This is in agreement with simulations by Okada et al. (2020) and might be attributable to the high surface roughness on Ryugu.
Simulating the temperatures in a spherical crater
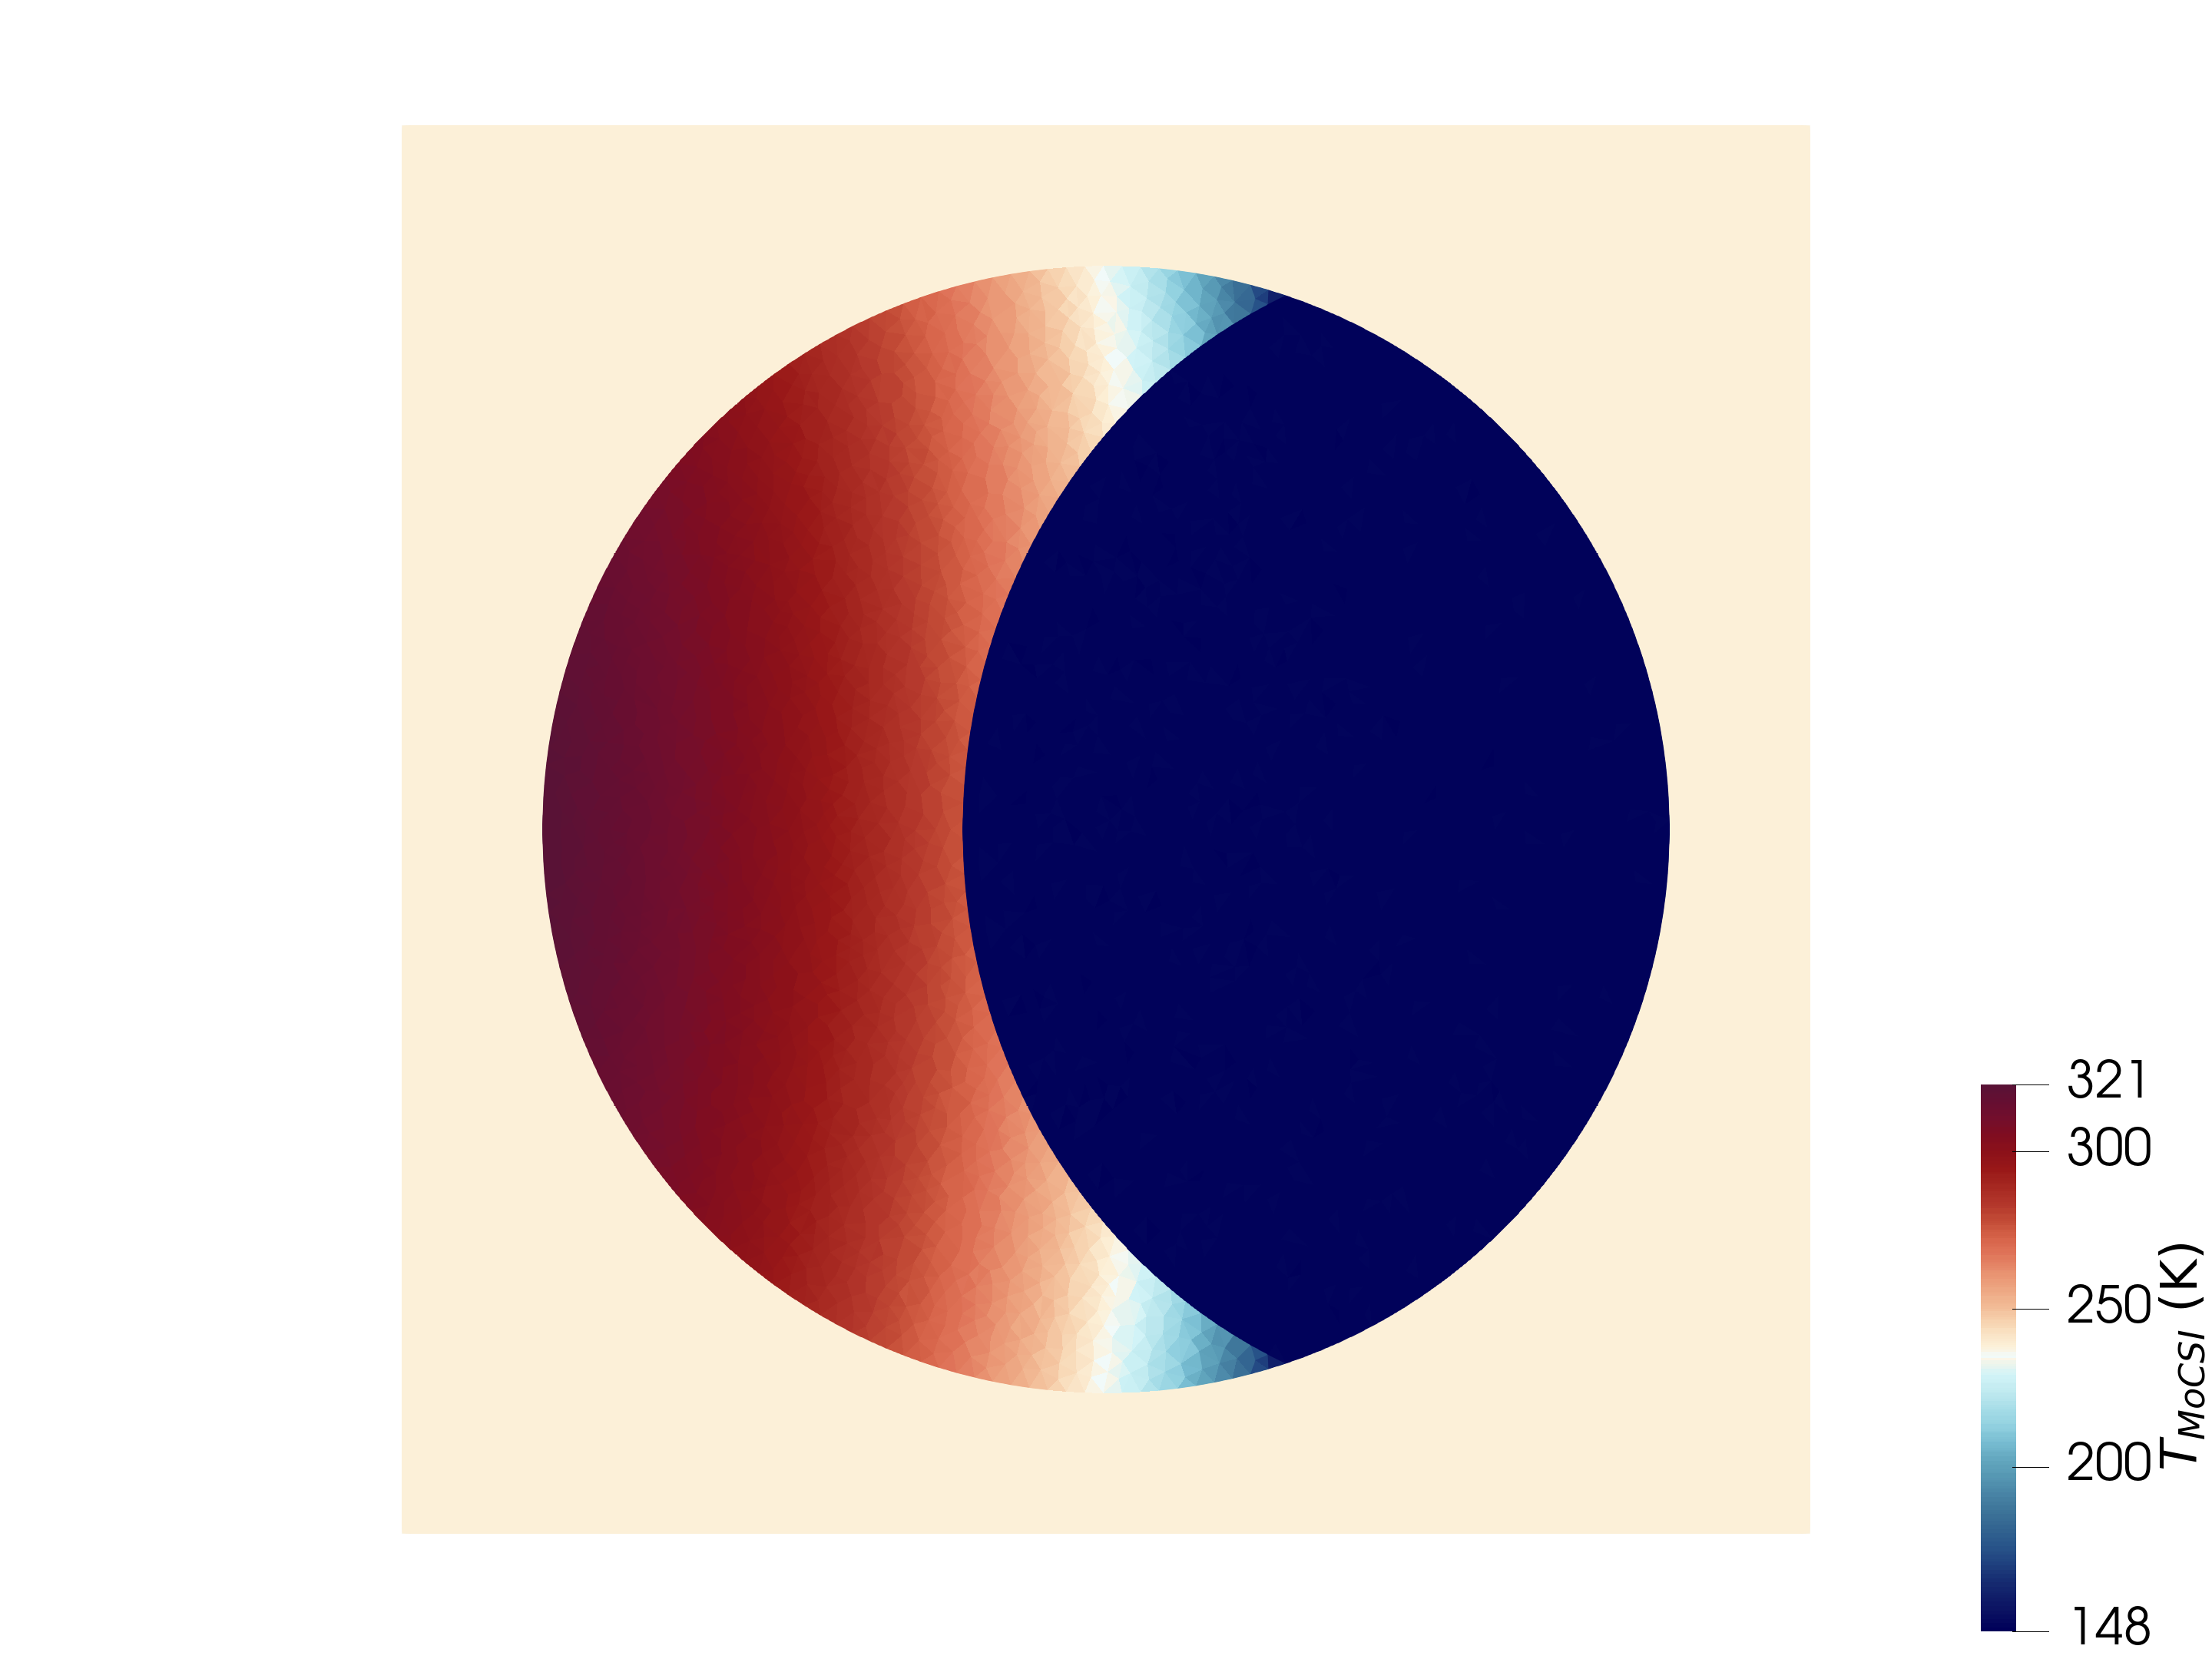
Using the radiosity module, we simulated the surface temperatures within a spherical crater (shapemodel with 14,198 facets) using the radiosity equations. The simulated temperatures can be compared with an analytical solution (Ingersoll et al., 1992). You can find further details in Schuckart et al. (submitted).
The simulated surface temperatures at 15° incidence angle are shown below.
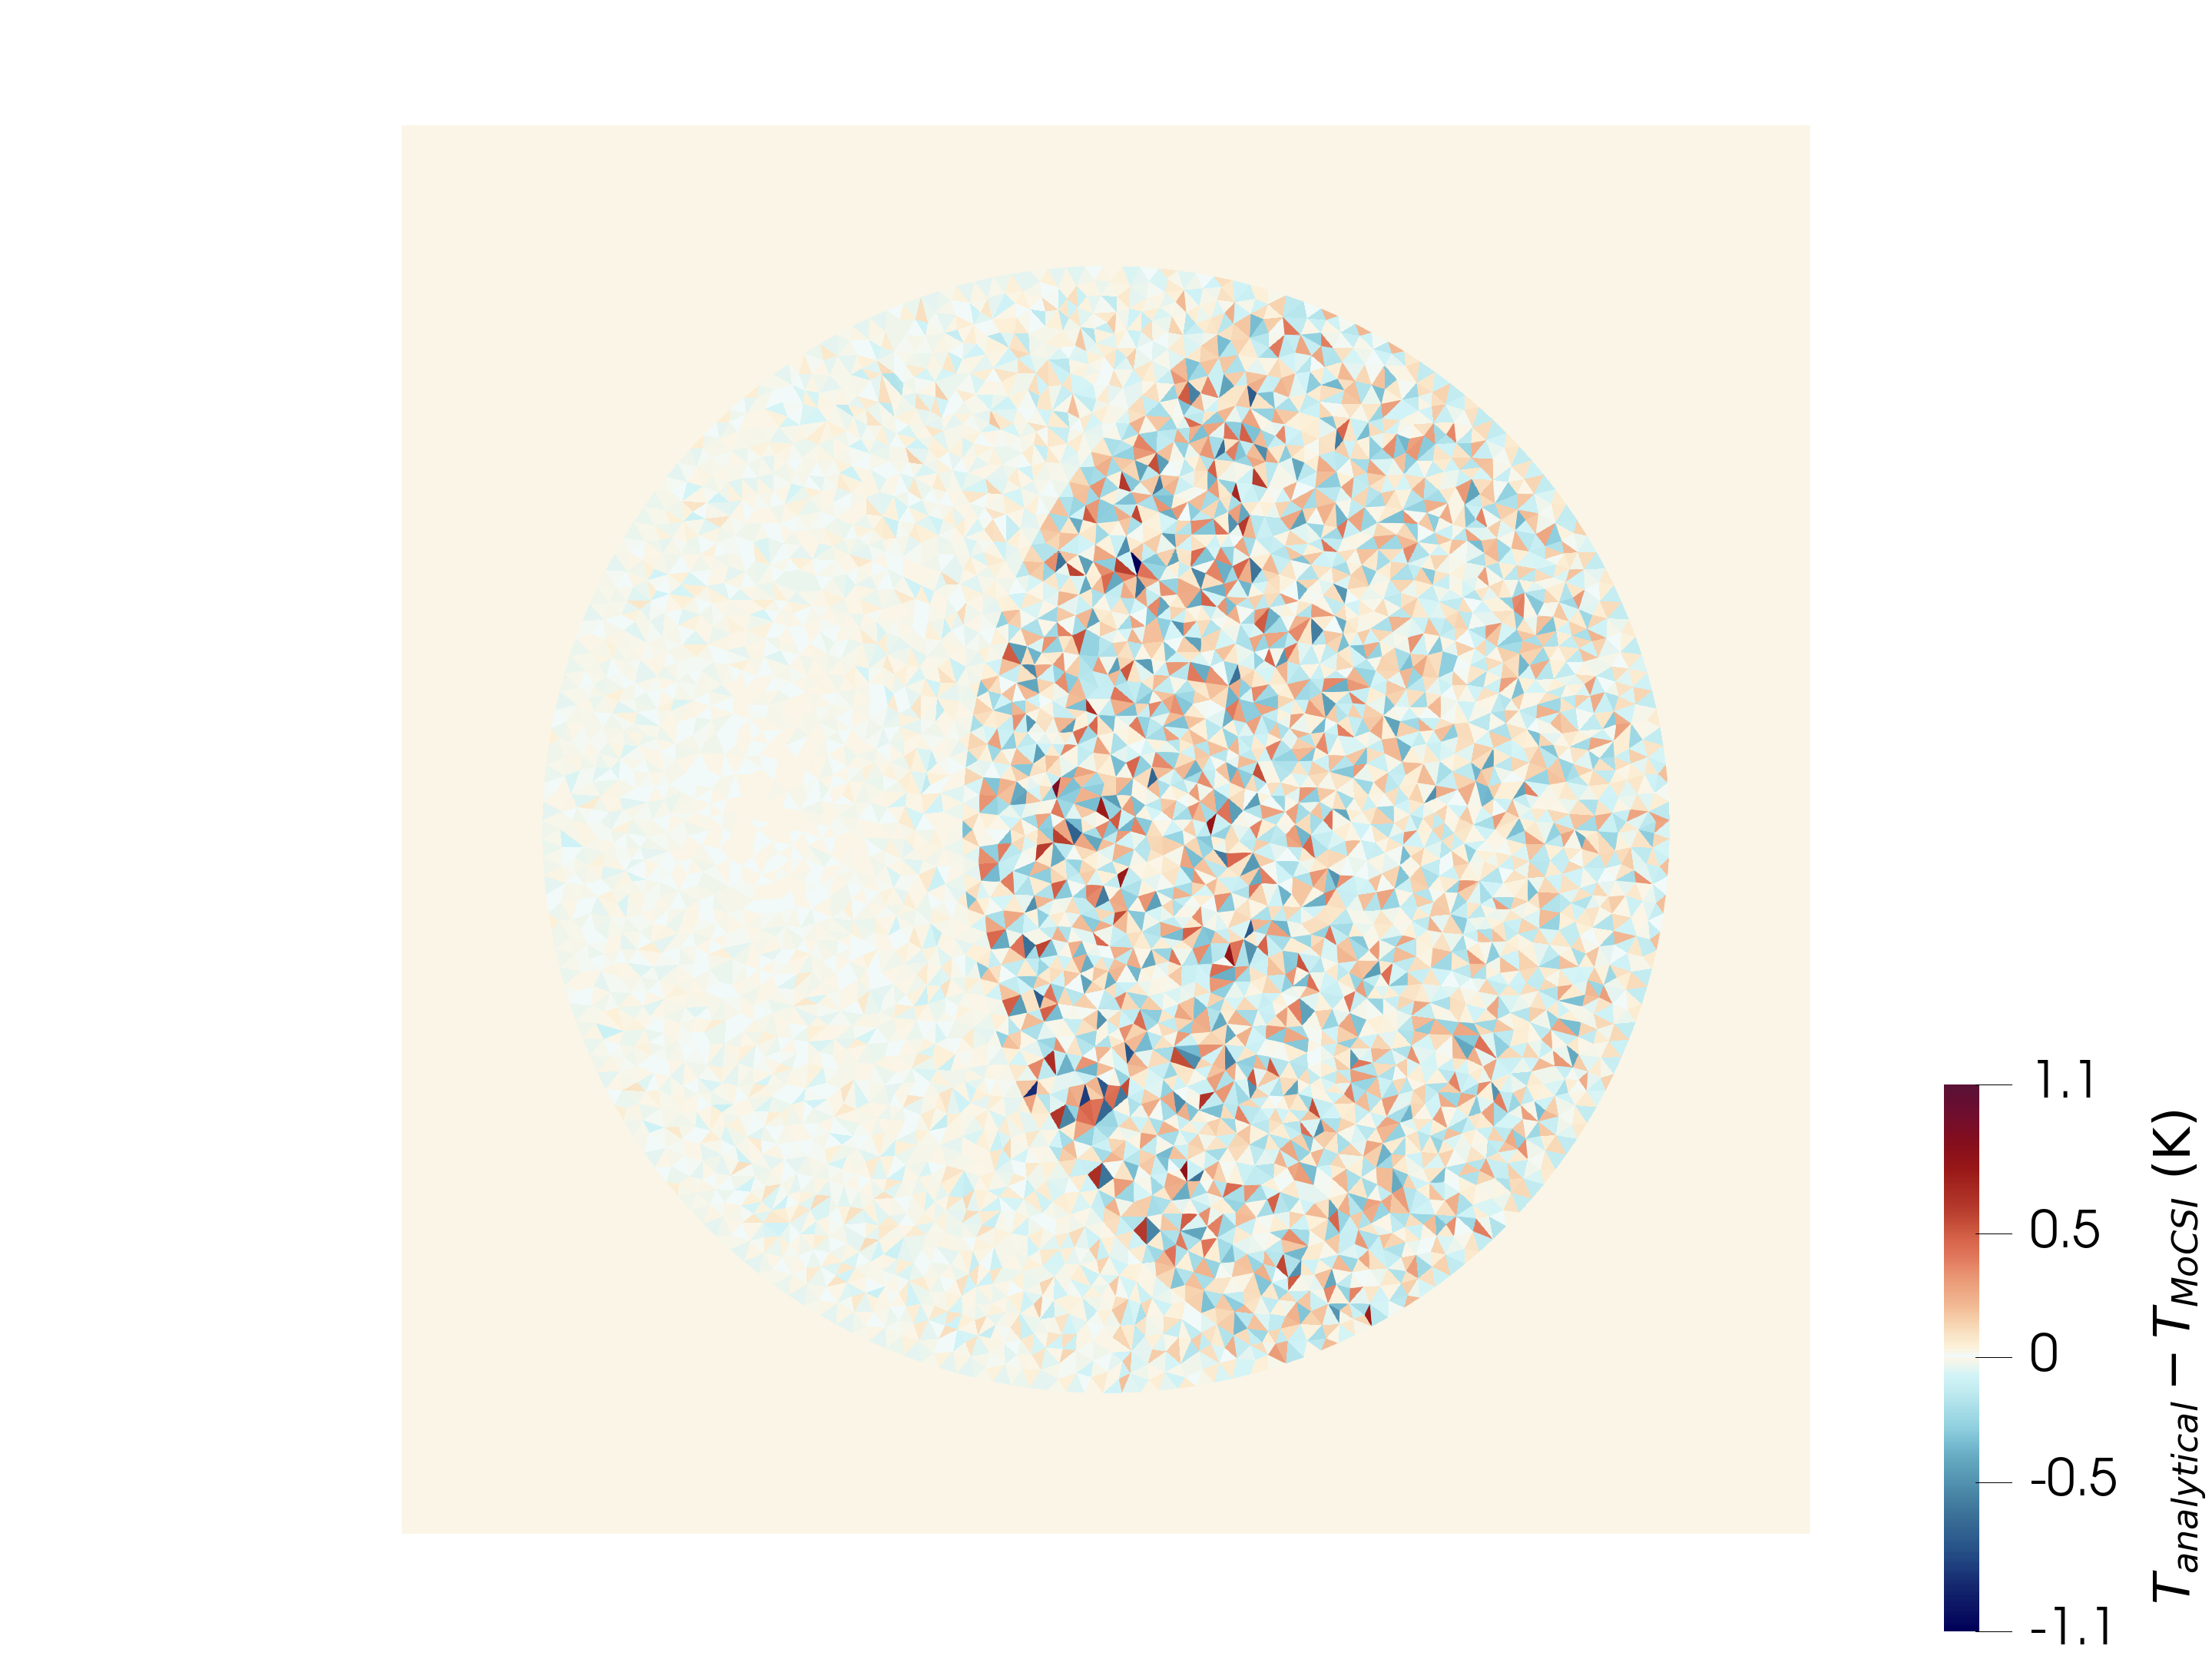
Moreover, the residuals between simulated temperatures and analytical solution are shown below. While the residuals in the shadowed region reach up to ≲ 1 K, in the sunlit side they are around ≲ 0.1 K and below.
Treating comet 67P as an asteroid
For a proof of concept, we also used the SPICE kernels and a shapemodel with 2,500 facets of comet 67P (Churyumov–Gerasimenko). In the simulation, we treated the comet as an asteroid by only considering heat conduction through dry regolith and the radiosity equations. The resulting surface temperature evolution is shown below.